Hey
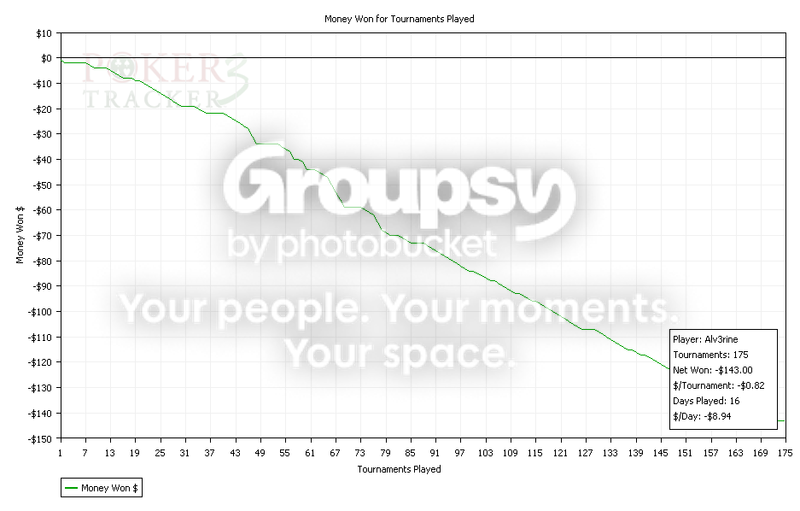
I just noticed that plenny people use graphs to see how well you're doing. How do you guys make this graphs? You use a help of a software or is everything manual?
Ive been playing for 14 days, with a $70 BR (from the $50 initial capital), but everyday I have variance, going back to $60 and then up again. Dunno if this a good result.
Im playing $1 SnG Turbo, played about 200 sessions.