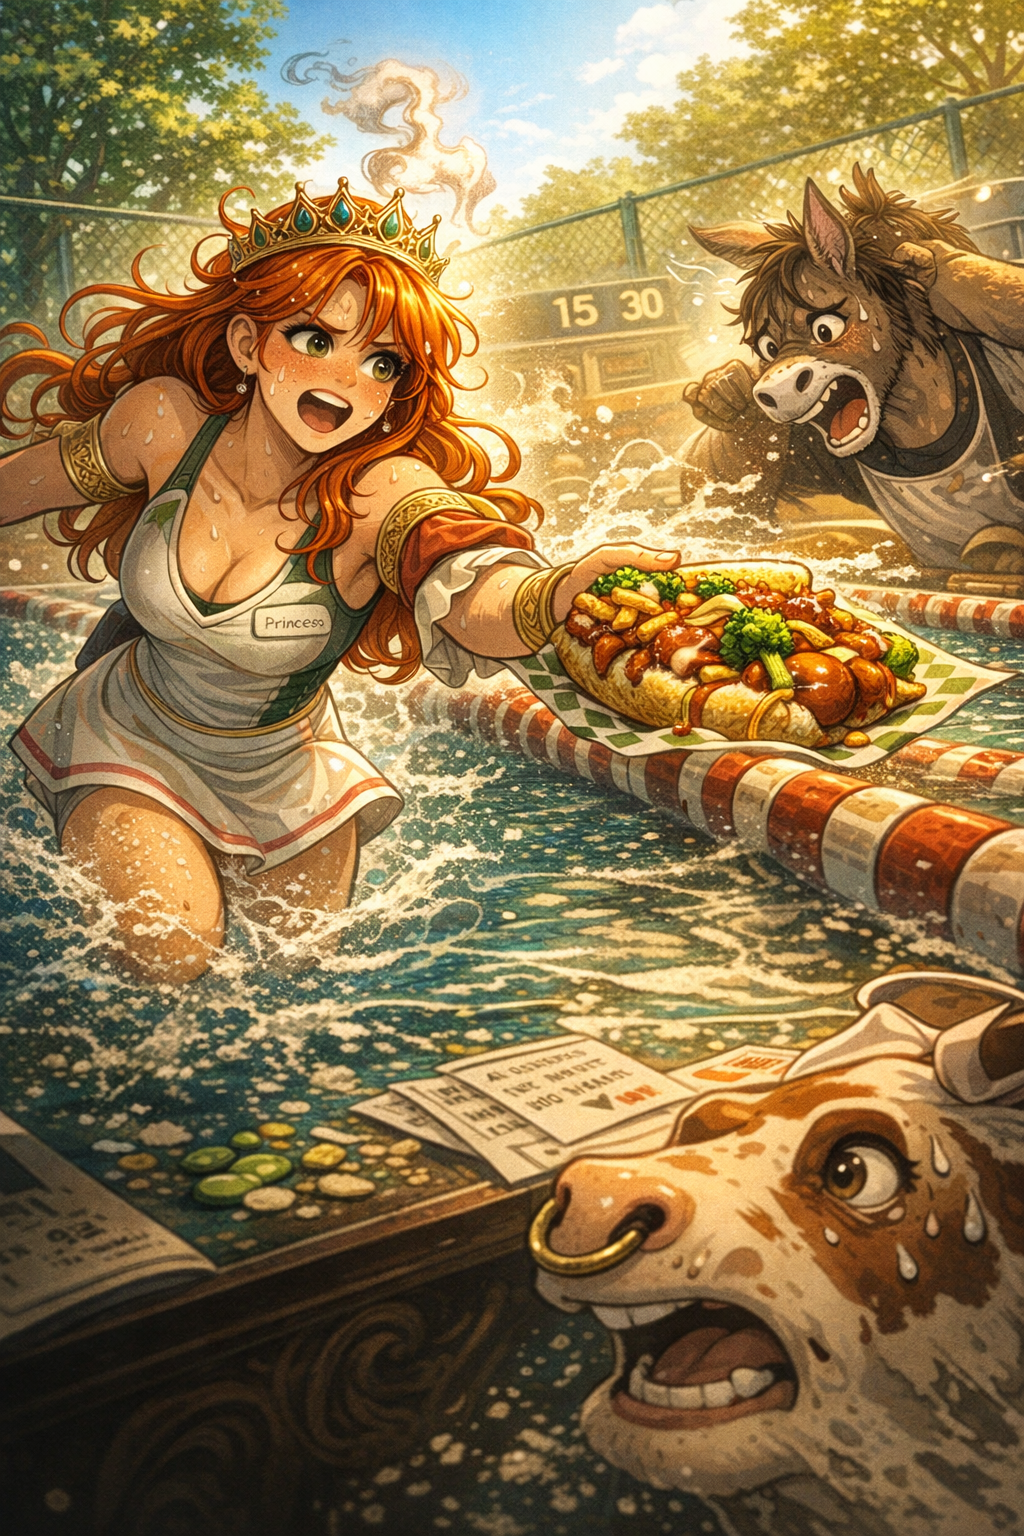
Nicely done, Prim!  And nicely done, ChatGPT, for realizing that tennis does not usually involve swimming lanes and hot dogs on the court in the middle of a match.
It's about time I get back to the tables, but first, let's look at some long-term SNG stats.
SNG Stats

On average, we made $50.45 per year (the value in the graph is lower because it also takes 2020 into account, where no SNGs were played). The total profit is $252.27.

ROI, meanwhile, shows a consistent declining trend.

Winter 2021/22 was the best season, which is when I first really got into those 5CD SNGs. I made a strong comeback in Fall 2022, but otherwise, results weren't great.
Take the average values in the following graphs with a grain of salt, because they all include 2020, but this is the cumulative profit per month, season and fiscal quarter.


It is interesting to see that the colder seasons were the best for SNGs, which was not the case for MTTs, where summer was best (graph in the spoiler below).
Spoiler

Traffic may be a factor, but the ROI graphs look pretty similar for the most part.


The overall profit graphs look like this:


In my next post, we will break it down a little by game format.



 The context for this can be found starting
 We played hard, we ran, we sweated, we had no mercy!
 Even though AI is not able to draw a tennis match correctly, I think you get the point anyway, right?





 Prim somehow managed to troll me there too, when she told me that she had found a nice duck dish at the buffet, and I circled around the whole thing like three times, inspecting every single dish while looking for that duck. It eventually turned out that Prim didn't pay attention to the labels at all, and must have picked some crispy chicken dish which she assumed was duck.
  Mostly due to the grindette's workload, we didn't get to do them as often as we liked this year, but the two meetups we did were absolute home runs. Our next one or two may have to be scaled down a little, because the season of Lent is about to begin - Prim is Catholic and I am considering becoming one, so we both participate to one degree or another. That was also one of the reasons why we decided to let loose yesterday and pig out at the buffet.


