Hi!
I promised prepare article about variance in Fixed Limit Holdem. Because it seems I cannot do it in one shot I will start thread and will update the post later.
Normal Distribution
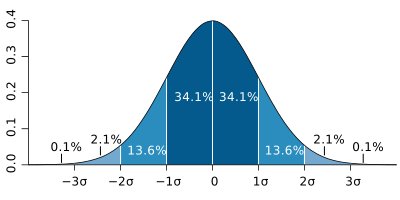
Many things that are affected by random factors behave according to Normal distribution. It does not matter if you are manfacturer of some part with required lenght or if you are waiting for bus that should arrive every 5 minuts.
Both of these examples will behave according to picture above. Only difference will be,
- that part is manufactured for lenght 1m (center of the distribution) +- 1mm standard deviation (Sigma) and
- bus will arrive every 5 minutes (center of the distribution) +- 20 seconds standard devition (Sigma).
The picture shows how many data will fit in interval from the center line.
For
- +- 1Sigma it is about 70% of all occurences - bus from previous example will arrive by 70% in interval 4 minutes 40s to 5 minuts and 20 seconds, this is general and normal behaviour.
- +- 2Sigma it is about 95.5% of tall occurences - so 19 times of 20 bus will arrive in interval from 4 minutes 20 seconds to 5 minutes and 40 seconds, we might assume that bus was delayed due to long stay on red light or driver was speeding.
- +- 3sigma it is about 99.97% all occurences - by this we can say bus will arrive every time with in interval of 4 minutes to 6 minutes. If does not arrive in this interval something special had to occure - e. g. flat tire.
We can apply same principles on poker game. In Fixed Limit Holdem we know that good player will have average income 1-2 BB (Big Bets) per 100 hands. At the same time we know that variance in Fixed Limit FR Holdem is about 15 BB per 100 hands.
Therefore players results per 100 hands will be
- by 70% in interval -14BB to +16BB
- by 95.5% in interval -29BB to +31BB,
- by by 99.97% in interval -44BB to +46BB
- in 0.03% he will lose more that 44BB or gain more than 46BB (naturally 1 time in 3333 cases)
Confidence Intervals
Two following pictures shows and the confidence interval in which should player stay. Note that x axis shows number of hands, y axis shows number of BB.
The narrow line is average income in BB per number of hands.
The inner lines shows 95.5% (2 standard deviation) confidence interval, the outer lines shows 99.97% (3 standard deviation) interval - player should never move outside these outer borders.
Tabels list some exact numbers for 100, 1 000, 10 000 and 100 000 hands.
Good FL Player

Excelent FL Player

Both picuters shows, that player are heavily affected by variance and even after 90 000 hands good player might be still breakeven (2stdev).
However excelent player is affected by variance less because he will be mostlikely in profit in just 25 000 hands (97.5%).
Accuracy of your winrate
Example:
From Jan 2nd to Jan 5th I played 4145 hands with winrate 4.24BB/ 100 hands.
Assume that stdev is 15BB / 100 hands. Therefore for 4145 hand the standard deviation of win rate is 2.33 BB/ 100 hands.
:spade:How big is chance that I am not losing player on my limit?
My winrate is 1.81 stdev (4.24/2.33) above being break even.
Outside (one sided) of 1.81 stdev lies 3.5% of values.
That gives me 96.5% confidence that I am winning player.
:spade:Second question would be how big is probability that my longterm winrate is bigger than 1BB/100 hands?
(4.24-1)/2.33 = 1.39 stdev -> distance in stdev between my current winrate and winrate I would like to achive.
Outside (one sided) of 1.39 stdev lies 8.2% of values.
That gives me 91.8% chance that my long term winrate is bigger than 1BB/100 hand.
:spade:The last question is, do I beat my limit with winrate at least 2BB/100 hands?
(4.24-2)/2.33 = 0.96 stdev
Outside (one sided) of 1.39 stdev lies 16.8% of values.
There might be chance about 83% that I will beat my level with winrate bigger than 2BB/100 hands.
What will follow?
- explanation how accurate is your win rate based on number of hands played
- anything that I will be able answer in there will be any questions
TTT