Skip to forum
How to interpretate...
 
Notifications
Clear all

How to interpretate blue and red lines in the graph?

15 Posts
7 Users
5 Reactions
11.1 K Views
mjez1
Joined: 29.06.2015

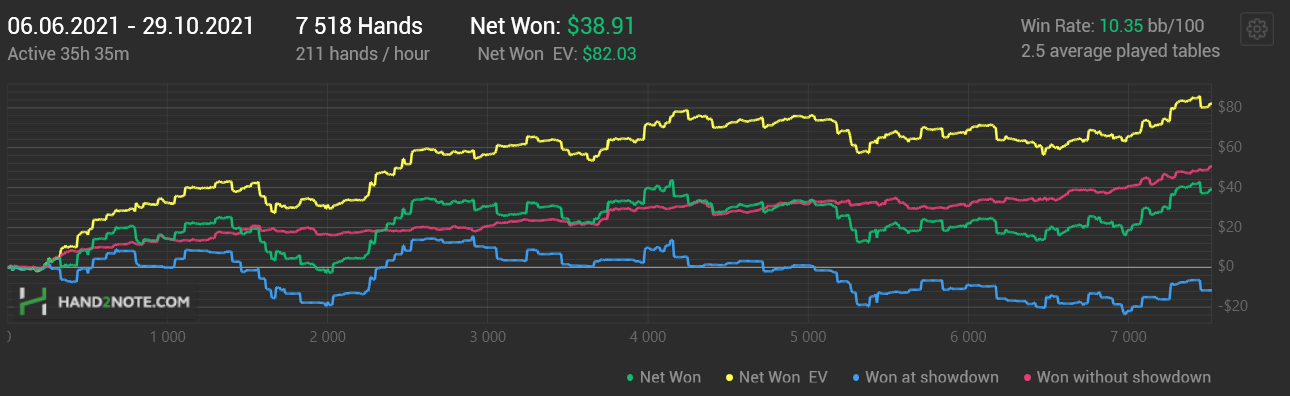
Hi, I took a second shot at NL5 this year. My sample size is not big, I'm aware but compare to a similar number of hands from NL2, the graphs are completely different. I feel I play both limits pretty same.
I don't get it why my red line goes almost up and the blue line goes done. What does the graph tell about my play?
How should I adjust?
(don't care about yellow and green lines, it's just a variance)

NL2:
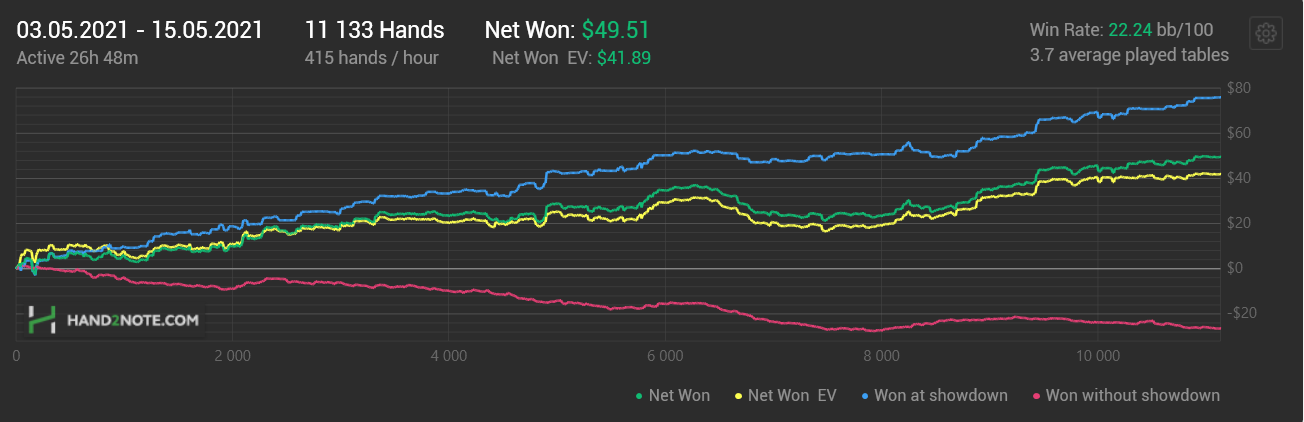
NL5:


Reply
Quote
14 replies
Ave27
Joined: 14.01.2007

This is just my opinion from what I see and read, but at lower steaks your blue line is always pretty high. Get a lot of rec calling stations. At lot of great advice for micro's is isolating limpers with weak ranges and betting for thin value. So you get a lot of showdown value with weak top pairs and such that you can call down with. I like to think of the red line as my bluff line, You have a strong draw bet it for two streets, they give up on the turn and your red line goes up a bit. The blue line goes up, when you take people to value town (so all your all-in's, all the value hands you bet three streets with against rec players/calling stations)


Reply
Quote
Super Moderator
VorpalF2F
Joined: 02.09.2010

No discussion of red lines and blue lines is complete without reference to this thread:
https://forums.pokerstrategy.com/forum/thread.php?postid=1214424#post1214424

In that thread, one or our coaches discusses the differences, what causes them to move in different directions, and how they trade off against each other.

Enjoy,
VS


Reply
Quote
mjez1
Joined: 29.06.2015

Originally posted by VorpalF2F
No discussion of red lines and blue lines is complete without reference to this thread:
https://forums.pokerstrategy.com/forum/thread.php?postid=1214424#post1214424

In that thread, one or our coaches discusses the differences, what causes them to move in different directions, and how they trade off against each other.

Enjoy,
VS

Thank you, I will read the article from weazel


Reply
Quote
EmiyaKiritsugu
Joined: 13.08.2013

Its very small amount of hands on both graphs so you cant make any decisive conclusions. Anyway - for me it looks like on nl5 you were very unlucky. You were constantly coolered so your blue line is piking down. As for redline - it can be that no one was paying you off when you hit. They fold so redline goes up.

Keep in mind that cash games are like marathon. You can be best player on table and be losing after 50k hands. I suggest looking at EV line because its slightly better approximation to our real winrate than green line. For me it looks like you are probably winning player on nl5, sometimes its just harder when cards doesnt want to work with you.


Reply
Quote
mjez1
Joined: 29.06.2015

Thanks,
I wasn't sure if I do suddenly something totally incorect.

I will keep playing :f_grin:


Reply
Quote
GepsiMax
Joined: 09.08.2010

I think if everybody plays exactly sameway then graph looks like that cause of a rake. usually red or blue going 10-30% faster up than other down, and yeah if you want other going straight its almost cost of a other going up little slower

if everybody calls you down 100% when playing and blinds? your redline HAS to go down because you are folding blinds. so dont stress about them, green line only matters and who cares you got that what ever other line IMO


Reply
Quote
mkBISCUIT
Joined: 19.01.2018

blue line is just money won at show down, red line of course is money won when no show down... Keep in mind every time you fold your red line drops. alot of the red line drop comes from BB and Sb play. a fun little thing todo in your tracker is take out the BB and Sb hands, then you can see how much they affect the lines.

Good luck
Keep Grinding


Reply
Quote
mjez1
Joined: 29.06.2015

Originally posted by mkBISCUIT
alot of the red line drop comes from BB and Sb play. a fun little thing todo in your tracker is take out the BB and Sb hands, then you can see how much they affect the lines.

I did that and this is the result. Seems interesting to me.


Reply
Quote
GepsiMax
Joined: 09.08.2010

i try 5K hands positive red NL5 zooom without monkey moves offcourse :f_cool::f_biggrin:


Reply
Quote
GepsiMax
Joined: 09.08.2010

hell no happening way too much multiway pots

lets try 3k hands to treat multiway pots differently


Reply
Quote
GepsiMax
Joined: 09.08.2010

and same to see redline conspiracy that when you start playing differently its going straight sometime then start falling cause some bots catching up your playstyle :f_cool::f_biggrin::f_biggrin::f_biggrin:


Reply
Quote
Coach
Kyyberi
Joined: 09.07.2010

Best way to improve redline is to remove fold button. Red goes sky high.

But the blue will go down. To improve the blue, only go to showdown with stone cold nuts. But the red will go down.

They are always linked to each other, and to opponents. In a call happy environment, winnings come from the showdowns. In tight environment, winnings come from non-showdown. You should take what opponents give to you, instead of trying to force anything. In the end, green and orange lines matter.


Reply
Quote
GepsiMax
Joined: 09.08.2010

Yeah, Kyyberi is right! :f_drink: Yeah its possible, here is just bad sample size all sick spots ! betting river thin value is saving redline and if they call too much it goes to blueline and imo better exploit them nits/maniacs not getting that 5% change to raise you to value or crazy bluff.. yeah who cares bout those lines.. :f_cool: cheeers:f_drink:


Reply
Quote
Super Moderator
VorpalF2F
Joined: 02.09.2010

I'm all in favour of a steadily-rising green line -- however it happens is fine by me :coolface:


Reply
Quote