


A deep look at the WSOP Main Event payout structure
This year's Main Event has a very odd payout structure for the final ten players and Barry Carter looks at the ICM implications of it.
One of the curiosities about this year's Main Event is the payout structure for the final ten players. There is a massive pay jump from 10th to 9th on the final table bubble of $425,000, however there is only $400,000 of difference between 9th and 6th. Also the top prize is almost double that of the 2nd place.
It's very unusual to see such a steep pay jump followed by smaller pay jumps, and it seems like the prize pool was tinkered with to create a marketable first prize of $8,000,000 while also making sure everyone at the final table becomes a millionaire.
I have compared this year's payouts with the 2019 Main Event final table bubble, where you can see a much more linear increase from pay jump to pay jump.
| Position | 2019 Prize | 2021 Prize |
|---|---|---|
| 1st | $10,000,000 | $8,000,000 |
| 2nd | $6,000,000 | $4,300,000 |
| 3rd | $4,000,000 | $3,000,000 |
| 4th | $3,000,000 | $2,300,000 |
| 5th | $2,200,000 | $1,800,000 |
| 6th | $1,850,000 | $1,400,000 |
| 7th | $1,525,000 | $1,225,000 |
| 8th | $1,250,000 | $1,100,000 |
| 9th | $1,000,000 | $1,000,000 |
| 10th | $800,000 | $585,000 |
Because I had just written a book on ICM a few people had mentioned the odd payout structure to me and what it might mean for the strategy at the final table. To look at that I thought it was best to take the chip counts from the 2019 final table bubble and look at the strategy, then put the same chip counts into the 2021 payout structure and see the differences. My suspicion was that the play would be dramatically tighter from 10th to 9th, but be significantly looser from 9th onwards, because the payout structure becomes so top heavy.
First a quick look at the 2019 final table bubble chip stacks:
| Player | Chips |
|---|---|
| Hossien Ensan | 169,500,000 |
| Nick Marchington | 43,200,000 |
| Dario Sammartino | 39,900,000 |
| Kevin Maahs | 39,200,000 |
| Timothy Su | 23,100,000 |
| Robert Heidorn | 13,000,000 |
| Zhen Cai | 44,500,000 |
| Garry Gates | 102,400,000 |
| Milos Skrbic | 27,000,000 |
| Alex Livingston | 13,000,000 |
I then looked at the Bubble Factor of each player on the final table bubble. Bubble Factor is way too complex to explain here, we cover it in our new book, but to really simplify it the higher it is the tighter you have to be to call an all-in. It's a relative metric, your Bubble Factor will be higher against players who can bust or at least hurt you.
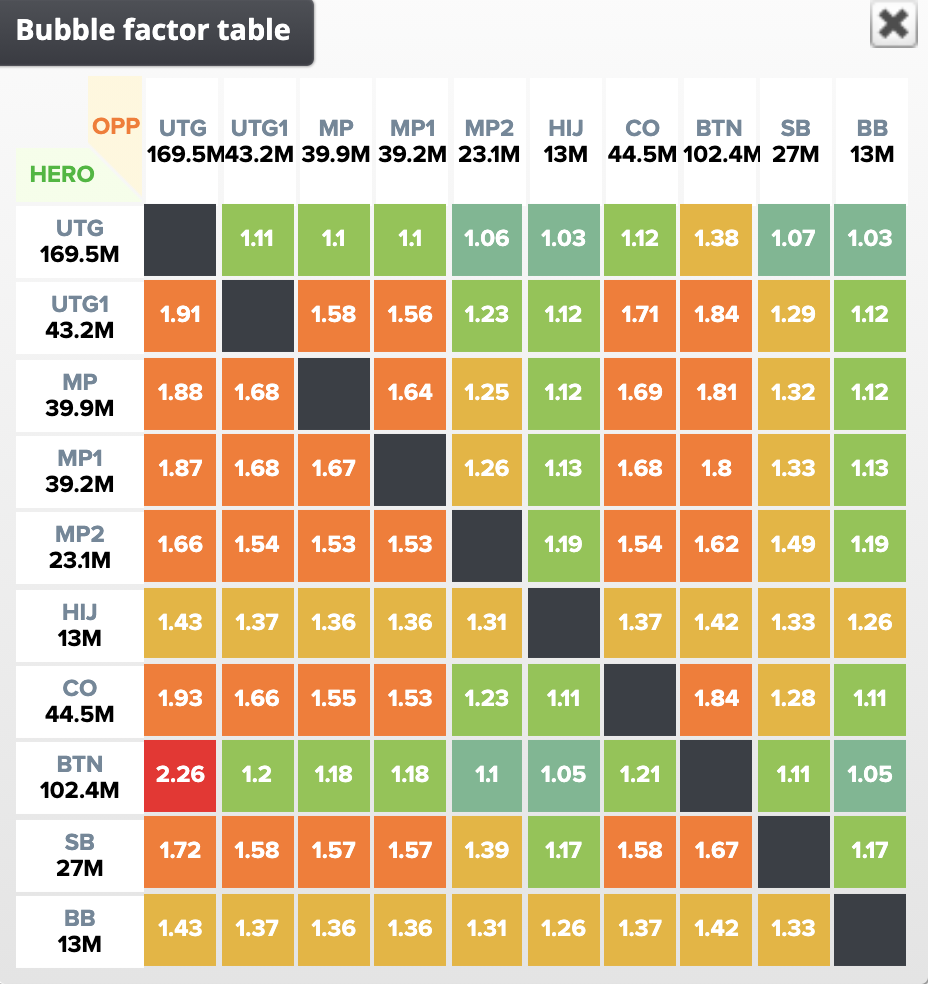
Below is a table for each Bubble Factor at the final table bubble in 2019. This was created using ICMIZER 3 which is a very useful tool for understanding ICM and really helpful because it shows you the Bubble Factor of every player against every other player.
For example Hossien Ensan who is UTG has a Bubble Factor of 1.1 against Nick Marchington who us UTG1. This is a really low Bubble Factor in fact it's close to ChipEV. He would only need to have 52.3% equity here to break even. This is because Ensan was the big stack and losing an all-in to Marchington would not hurt him too much.
Garry Gates, however, has a Bubble Factor of 2.26 against Ensan, because Gates was 2nd in chips. Being eliminated as 2nd in chips would be a disaster and Gates needs almost 69% equity to be breakeven against Ensan. Against most ranges that might mean folding Queens and certainly folding Ace King:
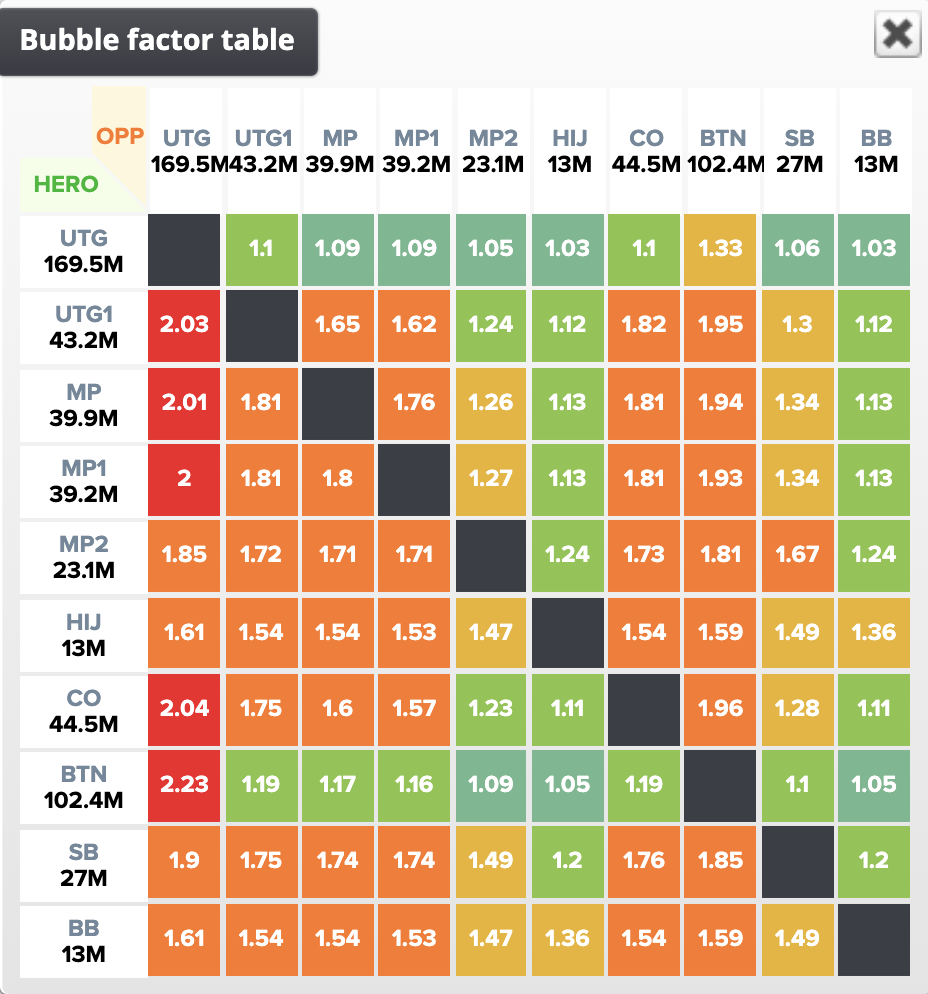
If we magically transported that final table bubble to this year's event, as you can see the Bubble Factors are all a little bit higher because of that big pay jump. Alex Livingston, the short stack, for example, goes from 1.43 to 1.61. This is a jump from needing 59% equity to needing 61.5% equity. Against a player with a tight range that is the difference between being able to call with Pocket Jacks to having to fold them (Ace King is a fold in both scenarios by the way). Looking at the other spots at the table this was pretty much relative the difference between the payout structures, not much. However, as we have written before getting a calling range wrong by one pip can be very costly. Ultimately the final table bubble is tight regardless of the pay jump as after the money bubble it's when ICM plays the biggest role.
The biggest strategic changes happen after the final table bubble has burst. This is what the official final table looked like in 2019:
| Player | Chips |
|---|---|
| Hossien Ensan | 177,000,000 |
| Nick Marchington | 20,100,000 |
| Dario Sammartino | 33,400,000 |
| Kevin Maahs | 43,000,000 |
| Timothy Su | 20,200,000 |
| Zhen Cai | 60,600,000 |
| Garry Gates | 99,300,000 |
| Milos Skrbic | 23,400,000 |
| Alex Livingston | 37,800,000 |
These are the new Bubble Factors once we have reached the finale:

And these are the adjusted Bubble Factors if we had used the 2021 payout structure:

You'll notice they have all gone down considerably compared to the final table bubbles. In the 2021 example Garry Gates now has a Bubble Factor of 1.97 compared to 2.23. Comparing the official final tables in the 2021 example everyone can get their money in wider because the payout structure is so top heavy. Not dramatically it has to be said, it is usually going to be the case of the bottom of the calling ranges gets one 'pip' wider but broadly speaking you can see the colour coding (Green meaning wide all the way to Red meaning tight) has changed for a lot of the Bubble Factors.
So as suspected the final table bubble is more severe in 2021, though not as much as expected, and the players are less incentivised to ladder once it bursts this year. I did some more sims to reflect how the tournament progressed with every bust out and the 2021 examples were all wider for the same reason, there is more incentive to go for the top prize than in 2019 when locking up a guaranteed big cash was more important.
These are all simplified toy game examples but the broader lessons about Bubble Factor, and whom you should avoid locking horns with, are worth exploring. We cover it in detail in our new book and ICMIZER 3 makes it really easy to play around with these numbers because it displays every Bubble Factor for every solve.
Thoughts on the 2021 payout structure? Let us know in the comments:
