


Win rate differences between Spins & MTTs
Our friends at SmartSpin compare some important facts about variance and earning potential between the two formats.

I explained why it makes sense to move from MTTs to Spins in the previous article. Today we will look into win rates.
Let's compare earnings of two common scenarios for medium-stakes regs with a $1,000 bankroll which is reasonably achievable for most players, especially those with a regular daily job. Let's say that a player is allowed by his wife he wants to invest 60 hours monthly to develop his poker career.
To assess the possible win rate, we need to establish how many games we will be able to play within the specified time. We need to research what possible EV ROI% we expect to have and what stakes we decide to play with our bankroll not to bust quickly.
Volume * ROI% * Stakes = Expected Win Rate
Volume in MTTs
Tournaments can take many hours, and we need to prepare ahead for possible deep runs when reaching the late stages. Let's assume we play 10 sessions a month, which is quite reasonable. Each session can last 6 hours on average, but sometimes they can be shorter if you run bad. In a typical 6-hour session, it's possible to play around 20 MTTs with a good tournament selection and a moderate amount of tables at once. 20 MTTs x 10 days = 200 monthly = 2400 MTTs yearly .
Volume in Spin & Go's
The advantage of Spins is that if we only have 60 hours to invest for poker, we don't need to play 6 hours sessions like in MTTs, but we can adjust the schedule to our needs. We can play longer sessions during weekends: 4h x 2 days x 4 weekends = 32h. We split this into 14 sessions/month during weekdays, 2 hours each. For most players, I recommend focusing on quality and playing from 2 to 3 tables at once, which allows us to play around 20 games/hour. 60 hours equals 1200 Spins per month . With such an adjusted schedule and regular, shorter sessions, our play quality will be higher than less frequent but longer and more draining sessions.
ROI% in MTTs

It's very hard to measure someone's EV ROI, as we don't have any universal indicator. There are many different variables in tournaments, such as:
- starting stacks
- blind levels length
- blind levels steepness
- bounty-existence
- re-entry and late-registration
- different reg ratio % in the same tournament depending on the time of the day and day of the week
- singular ICM decisions on final tables that affect the EV ROI% by a lot
We can only guess possible ROI based on large sample sizes of regs results.
Based on sharkscope results, we can see that average good regs achieve around:
- 45% ROI on avg. bi. $10 = $4.5/game
- 30% ROI on avg. bi. $20 = $6/game
- 20% ROI on avg. bi. $40 = $8/game
Obviously, it doesn't mean that these will be your results after each tournament or month. It depends on the field size. To reach the long run, we would need to play over 5000 games on avg. field size of 1500 players and way more for larger tournaments. When we are playing 150 games a month, we should expect to have a profit after two years, which would split into the average of what we expect monthly. At the same time, singular months can end with no profit or loss. Still, even after 2 years, you won't be sure, as there's no clear indicator, and a singular score could've been made in a high field tournament.
The "funny" thing is that if we want to know our ROI, we will need to invest at least 2 years of playing to see our results, and when we see them, they're still not necessarily accurate.
EV+RB ROI% in Spin & Go's
These days rakeback has become a vital part of the winrate in Spins. That's why we will focus on the EV post rakeback (EV+RB).
Each tournament has the same amount of chips to be won with the same structure, and there are 1500 chips in each game. Using a simple stat of "all-in adjusted chips/game" as an indicator allows us to measure our efficiency.
There are almost no ICM factors that shift our game from cEV strategy (only in 10x/25x where 2nd place gets a higher prize than the 3rd place: 6,000 times per 1M Spins - 0.6% of the time, and the difference is only 1 BI ):
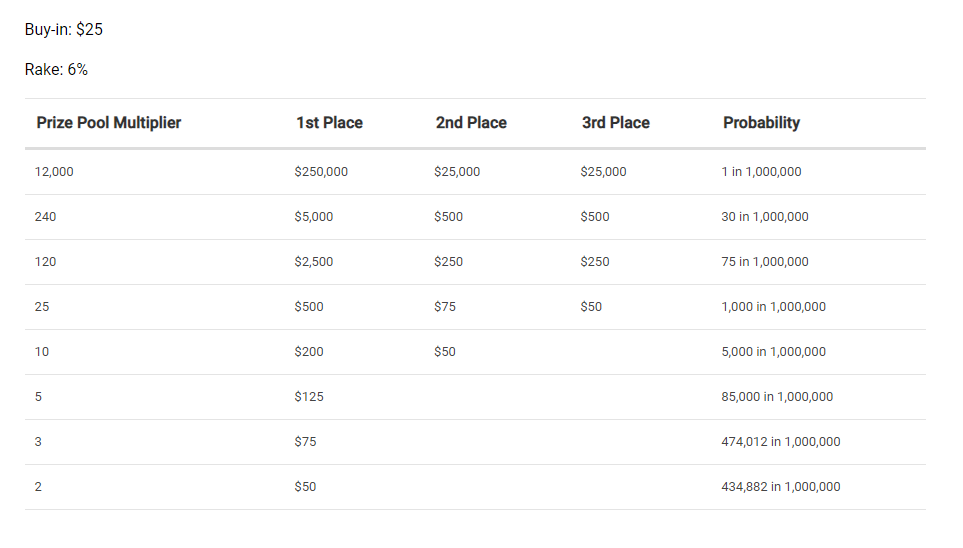
Reg ratio is easy to measure as you always know the whole field of players you play against because you see them on your table. With simple PT4 filters, you can measure your results vs. groups of regs and unknown players to understand your edge and improvement points.
As a rule of thumb, I often count that a very good reg can earn around 1 evBI per hour (4% EV+RB ROI x 25 games/hour). In our example, I assume we will need to play fewer tables (20 instead of 25 games/hour) to achieve a 3% EV+RB ROI.
In Spins, even after 3,000 games, so after 150 hours of play, you should be able to see your long-run cEV with high probability, and you should be able to tell your win rate. This allows moving to higher stakes by looking only at our chipEV results, and we don't have to wait for many months/years to see our long-term ROI%. Quicker promotion to higher stakes increases our win rate a lot.
Choosing stakes in MTTs

Setting the bankroll requirements is the most vital factor limiting us from playing higher stakes. I believe that most of us would achieve positive long-run ROI in $10,000 WSOP ME, but we won't play it because of bankroll requirements and variance. Skills aren't the main factor - bankroll is as it allows us to play, generate our EV and reach the long run. If we have a $1,000 bankroll, what stakes will we be able to grind with a reasonable chance of avoiding bankruptcy? I will take aggressive requirements as we don't need to be that conservative when considering an amount that's simple to accumulate. Let's look for at least a 70% chance that we won't go bankrupt over one year of a grind.
Using Poker Variance Calculator, we can see that risk of busting a $1K bankroll is following on 2400 sample (yearly volume):
- 45% ROI on avg. bi. $10 = $4.5/game - 32%
- 30% ROI on avg. bi. $20 = $6/game - 70%
- 20% ROI on avg. bi. $40 = $8/game - 87%
Even if you believe your earnings would be the highest on higher stakes, the variance won't let you realize your equity frequently, and you'll lose your bankroll.
Choosing stakes in Spins
Using the SwongSim calculator, we can see that to stay below a 30% chance of busting our $1K bankroll, we need to have an average BI of $25 with 3% EV+RB ROI on a 1200 monthly sample. The chance of bankruptcy raises to 45% with annual volume, but this isn't the number we should worry about. If you join the EV Pool, it will protect you from variance every month and allow you to bank your EV and raise your bankroll every month. We only need to have a bankroll for a singular month variance.
Even if we would achieve higher EV on higher stakes, we are limited by our bankroll. If you believe you are under-rolled for your skills, most likely staking would be an interesting solution for you.
Total monthly EV

MTT's
- Stakes = $10
- ROI = 45%
- Volume = 200
- EV = $10 * 45% * 200 = $900
Spins
- Stakes = $25
- EV+RB ROI = 3%
- Volume = 1200
- EV+RB = $25 * 3% * 1200 = $900
As you can see, EV win rates are the same! But are the results the only thing that matters? What makes the difference is:
- Variance - which almost doesn't exist in Spins thanks to Smart Spin EV Pool
- Schedule - which you can define by your needs and preferences
- Stakes - which can dynamically change depending on your skills thanks to EV, which is simple to measure
- Bankroll - easy access to coaching for profit services from Smart Spin is available for players even on the lowest stakes - you do not need to invest anything nor be affected by monthly variance
This article is written by CuAt69UsdSng, who has been a full-time MTT pro who transitioned to Spin & Go's, where he won more than $1M+ in EV+RB. He is a High Stakes Player, a coach, and CEO of Smart Pool - an EV Pool for Spin & Go's players providing protection from the variance. You can find more about it here .
