


Future Game Simulation (2): Understanding the crucial driving factors
 |
Before reading this lesson, you should have previously read through Future Game Simulation (1) – Introduction. By now you should understand when and why it is better to use FGS instead of “plain” ICM calculations.
In this lesson you will learn about the key factors that drive the difference between results produced by ICM and FGS, which will help you to understand both of them and adjust your ICM-trained intuition in-game, when performing detailed calculations is impossible.
Watch your stack size
 |
As you remember, the idea behind FGS is that it looks into the future and incorporates the value of future strategic options (or lack thereof) into what would otherwise be ICM results. ICM, in its basic form, implicitly assumes that the rest of the tournament is played out at random, with the action not biased towards any player.
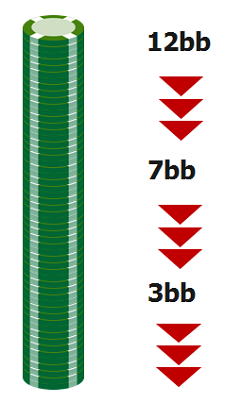
There are however several other factors (and that is not including skill!) which determine the profitability of the player or, more precisely, of a stack in the hands yet to be played. One of them is the stack size. When you include the availability of a non-all-in 3-bet as a strategic option, it gets more complicated, but even in a push or fold mode there are stack sizes which are destined to fare better than others.
The relationship between the stack size and future profitability depends on the risk premium factor. In low and medium risk premium environments, typically a lower stack (assuming you are in the push or fold range, excluding nano-stacks, so 3-12 bb for the purposes of this article) is more profitable in every future hand.
Note, this does not mean that a short stack is more valuable than a bigger stack. It means that it will – on average – increase in value with every hand faster than a bigger stack would. As a result, FGS values short stacks even higher than ICM does (which in turn is higher than a chip chop valuation).
Take a look at an example of how per-hand-profitability changes with stack size in a low risk premium environment (i.e. far from the bubble):
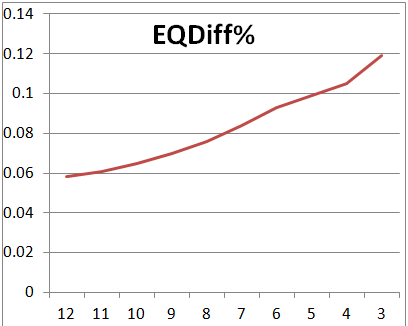 |
| Profit per hand by stack under low risk premium (example) |
EQDiff% shown in this chart is a tool for quantifying per-hand-profit. In ICM calculations it shows the profit (or loss) as a percentage of the remaining prize pool. It is therefore important to remember that this is not an absolute value and, as such, comparisons between EQDiff% for different examples is pointless.
Other than the steadily increasing slope of this curve, another thing to note is the slightly less steep segment between 6 and 4 bb. This is where the majority of the “loss of FE (folding equity)” effect takes place. You can see that this effect – although clearly noticeable – is not strong enough to overcome the basic effect of the dead money (blinds and antes) being more significant compared with the shorter stack. This is important to remember, as overestimating the “loss of FE” effect is a common misconception.
Things look a bit different in a high risk premium environment, like in the bubble phase or at the final table. Here, if you fall under a certain stack size, the loss of FE hurts you a lot, as you cannot simply push your value range and profit despite the lack of FE. High risk premium means that you need to avoid risks, and by doing that you inevitably slowly blind down.
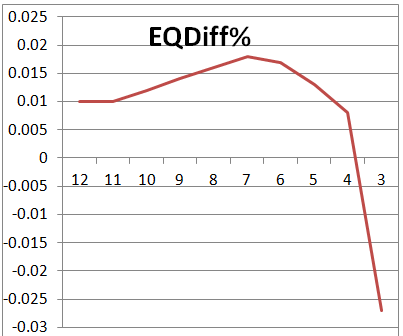 |
| Profit per hand by stack under high risk premium (example) |
Here, the effect of losing folding equity is tremendous. The most important conclusions to be drawn from that are:
1) try to keep your stack above the point where the playability starts to drop rapidly, and
2) if you find yourself with a stack with negative per hand profitability (3 bb in the above example) you should be willing to take slightly –EV (as per ICM) decisions to get out of this spot.
The overall conclusion is that your approach to guarding a certain amount of fold equity depends on the phase of the tournament measured by risk premiums. Under low risk premium there is no gain in keeping the stack above the line to retain FE, while close to the bubble it can become an important consideration.
To visualise this, take a look at the following example from a 9-man SNG:
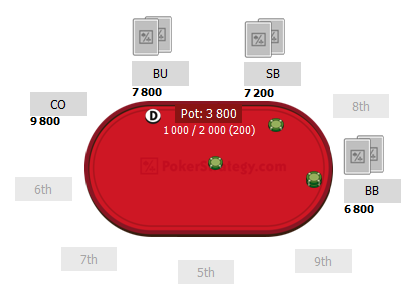
In this example, tight calling ranges are assumed for the blinds. They are assumed static, i.e. independent of our pushing range, which differs from the standard Nash procedure, but is a reasonable assumption for analysing a single hand in a vacuum. BU has 4bb and his ICM +$EV pushing range looks as follows:
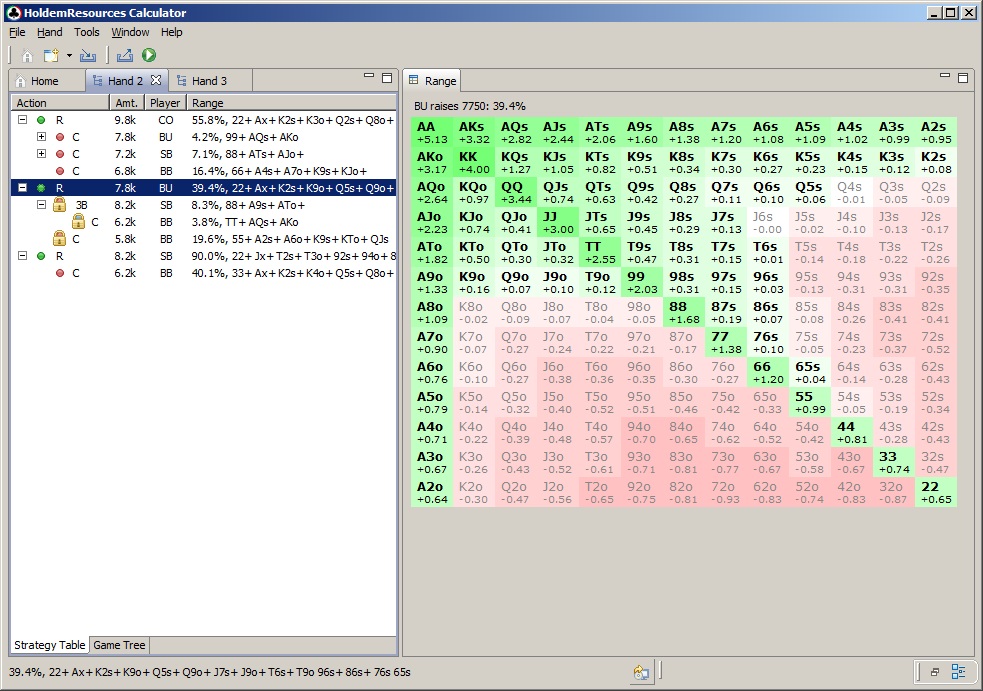
However, if you take into account that if you manage to steal the blinds you become the largest stack and can play future hands much more profitably, a lot of the -$EV (as per ICM) hands become +$EV (according to FGS):
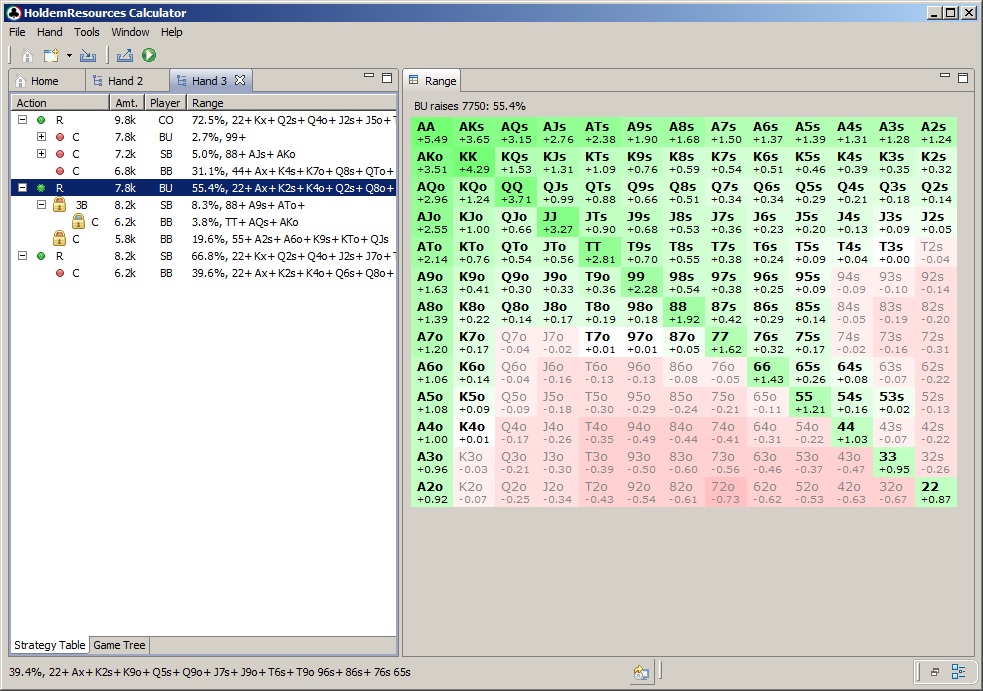
It is worth noting that this is indeed an effect independent of getting hit by the blinds – which will be the next point to consider – as the player in BU is in CO for the next hand, so still not in the blinds.
Position is crucial and getting hit by the blinds is costly
Another aspect driving the profitability of a player/stack in the next hand is his position. There is no universal rule on whether BU is better than UTG. It often is, but in many other circumstances it is more important to act first and limit the options available to others. One thing, however, remains the same. No one wants to be the big blind, and rightly so.
Your per-hand-profitability is almost always negative in the big blind. But what exactly is the price of getting hit by the big blind? Take a look at the following charts, comparing the UTG pushing ranges and the related profit excluding (ICM) and including (FGS) the price of paying the big blind the next hand. This was calculated for other players’ stacks of 12 bb and standard 9-man SNG payout structure of 50/30/20.
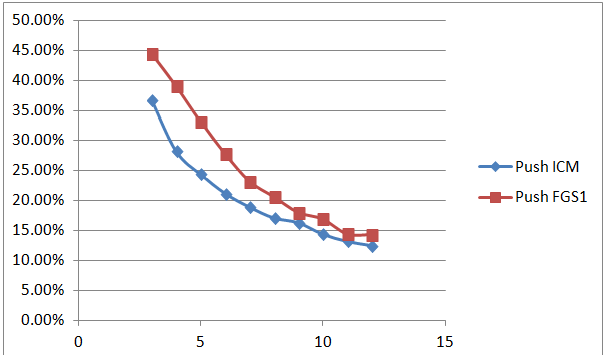 |
| Sample UTG pushing ranges by stack – comparison of ICM vs FGS |
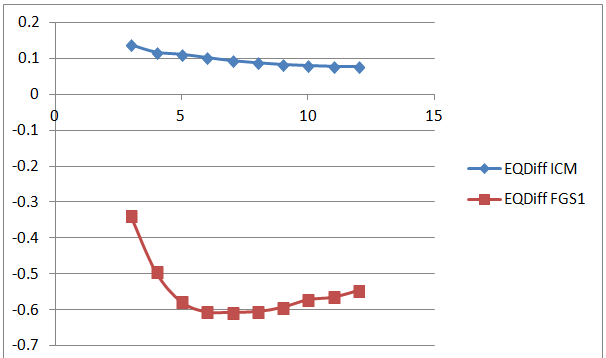 |
| Profitability of UTG pushing ranges by stack – comparison of ICM vs FGS |
You can see that the price is actually quite high – several times higher than the bare profit from pushing a correct range UTG. To take that into account, you need to widen your pushing range to include some hands that are – according to the ICM – slightly –EV to push but as staying alive is not as valuable as it seems due to the losses incurred in the next hand, taking a risk becomes +EV in FGS. That holds in general, and you should remember that because of the cost of being hit by the blinds, early positions’ pushing ranges need to be slightly wider than ICM or cEV would dictate.
Take a look at the following example showing the practical use of this rule:
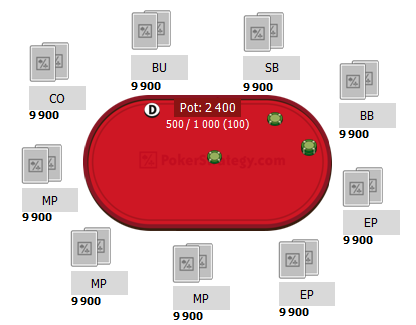
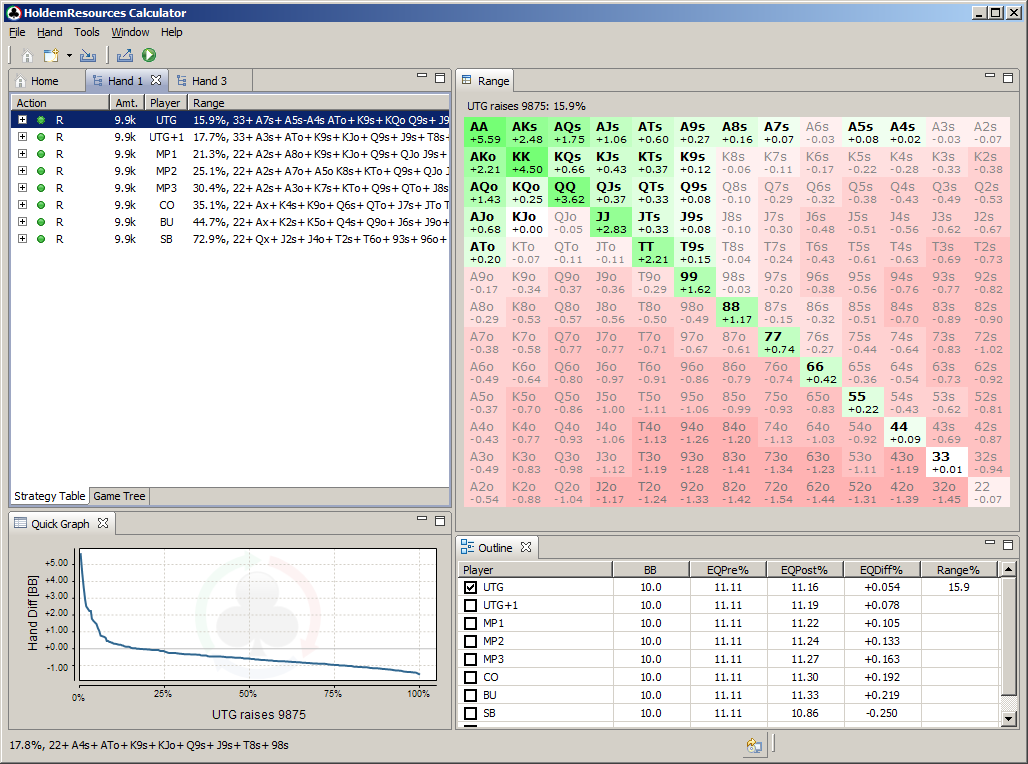
In this example, the regular (+cEV) pushing range from UTG with 10bbs is as shown below:
Whereas the FGS (+cEV) pushing range in the exact same spot is as follows:
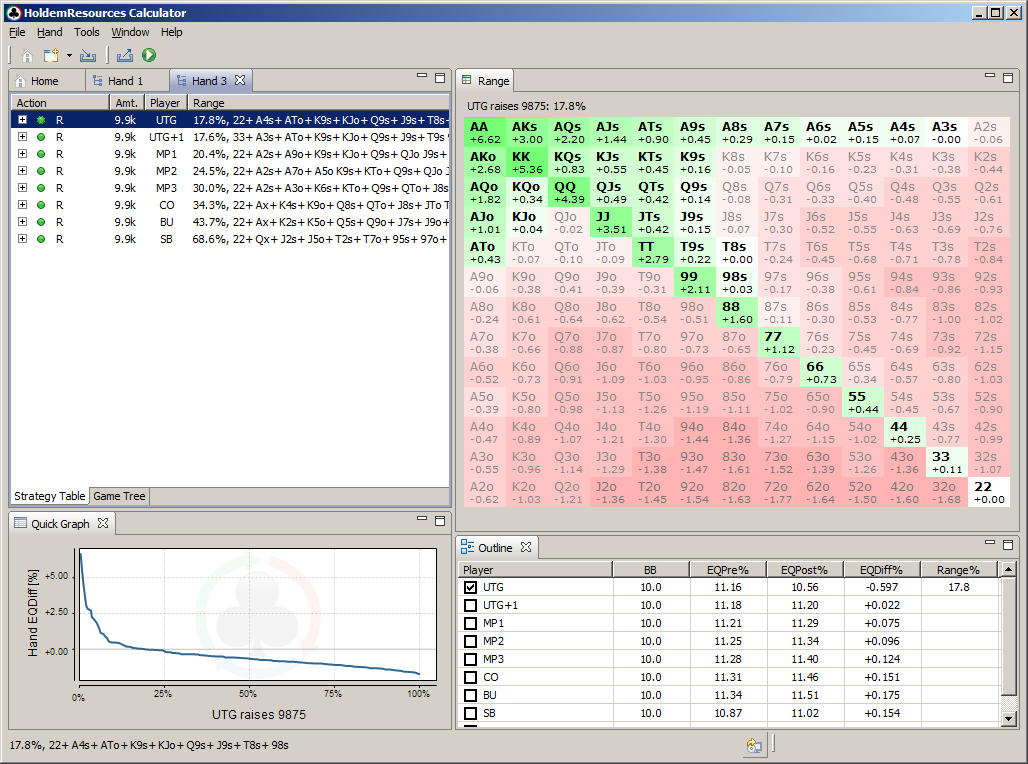
You can see that there are a number of hands which enter the pushing range when you consider the cost of getting hit by the blinds, namely 22, T8s, 98s, A6s and A3s.
Summary
In this lesson you have learned that:
|
 |
EP (2000 chips) – 6.8% 10.0% 11.6% 12.8%
CO (3000 chips) 5.4% – 14.4% 16.3% 17.9%
BU (5000 chips) 4.7% 8.0% – 21.2% 23.1%
SB (7000 chips) 3.8% 6.2% 12.9% – 25.9%
BB (10000 chips) 2.9% 4.6% 8.7% 14.6% –